
13th Annual Presidential Lecture Series
https://doi.org/10.17077/9nc5-zogg
Eco-logic:
An Environmental Perspective for the 21st Century
The University of Iowa Foundation Distinguished Professor
Department of Civil and Environmental Engineering
Thank you President Coleman, Professor Shapiro for the fine performance, distinguished colleagues and friends. It is indeed an honor and a privilege to stand before you today.
Humans have always been in tension with their environment as they seek out a better standard of living. Land has been cleared for agriculture or commerce, and animal populations have been exploited. What is different about the situation that we find ourselves in today is the magnitude of our impacts. We are more numerous. 5.75 billion people on earth seek out an existence, and we are multiplying. Every six months, there is another contingent of people equal in population to the country of France, almost 50 million. Imagine, every six months another France for whom to provide food, housing, shelter, and jobs. Every ten years, there is another population nearly the size of China. And coupled with population is the problem of an everincreasing per capita consumption, especially among developed countries. We are powerful. Twin juggernauts—burgeoning population and per capita consumption—are driving environmental change.
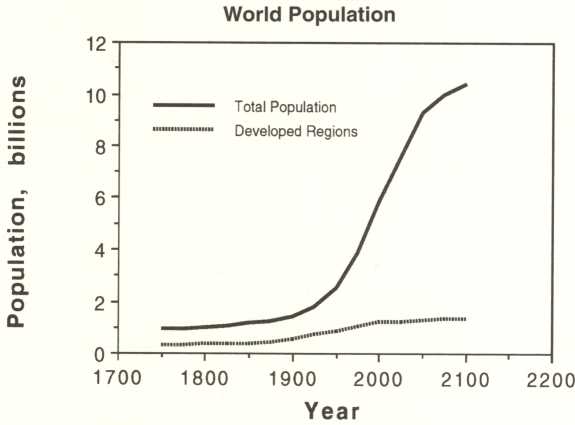
A projection of global population from 1750–2100 is shown in Figure 1. Following the industrial revolution, population in developed countries increased rapidly from 1850-1950. But more recently, developing countries in Asia, Africa, and South America have begun to increase their population much as the industrializing countries did 100 years ago. Global population is projected to rise rapidly until the end of the 21st century and then stabilize at 10–12 billion people. Population growth is the first driving force of global change.
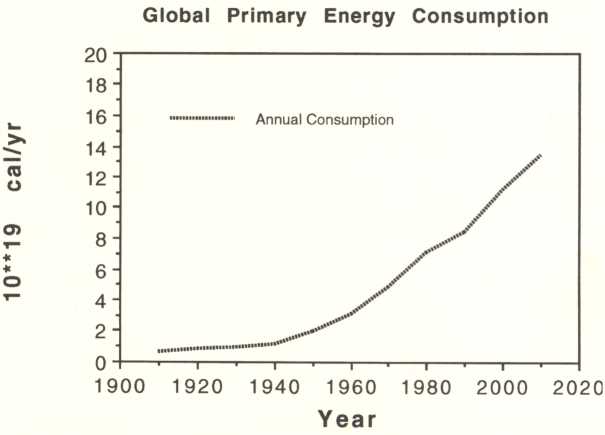
The second driving force is per capita consumption. It has grown as fast as or faster than population. From 1950–1986, the population doubled from 2.5 billion to 5.0 billion, a rate of 2.0% per year. But during that same period, the annual growth in global primary energy consumption was almost 4% per year, about double that of population. The example shows that consumption, especially among developed countries, has contributed significantly to our energy and pollution (emission) problems. Primary energy consumption is an indicator of global emissions to water, soil, and atmosphere (Figure 2).
Environmental Problems at the Local Scale
As early as Biblical times, humans changed the face of their environment dramatically. The flag of Lebanon has a stately cedar tree in the middle of it. But in Lebanon today, one is hard pressed to find cedar forests, though they once flourished. Phoenicians cut the magnificent cedars for export and for ship-building in the period 2900 B.C.–200 A.D., and the landscape has never recovered. In another example, over-grazing and deforestation accelerated the process of desertification in the northern Sahara, expanding what was once a small desert. There are no longer any native (pre-settlement) forests in Europe, and virtually no virgin forests remain in the United States east of the Mississippi River. But probably the biggest change to the landscape that humans have caused is due to fire, both the setting of fires in early days and, in developed nations, the prevention of fire, much to the detriment of species that depend on periodic, natural fires for their life cycle.
In more recent times, when pollution problems occurred in local areas, people just moved away to avoid them. If a stream became contaminated due to sewage or a waste discharge, people simply relocated upstream, above the contaminant source, for fresh drinking water. If the soil became exhausted from intensive agriculture, new prairie soil was plowed for planting. At the turn of the century, when loggers clear-cut all of the timber in the East, they moved to the Upper Midwest to harvest nearly everything, leaving a scar on the landscape. Native Americans held a different relationship with the land, but manifest destiny eventually ran its course, and citizens of the U.S. had to come to grips with a more limited resource base. Fortunately, many of these environmental insults were not irreversible. Trees have regenerated, the waters have self-purifying capacity, and even the land can be rehabilitated (although the recovery times can be long).
As nations have become more highly developed, their peoples have insisted on a cleaner environment. In the United States, water pollution from point source sewage discharges has decreased dramatically since 1972 when the Water Pollution Control Act was initiated. With a goal of restoring the nation’s waters to “fishable and swimmable” conditions, we have made great progress, and environmental doomsdayers should be reminded when they fail to acknowledge past successes. Economic “externalities” have become incorporated into the price of the product, to some extent, as the public has demanded a clean environment.
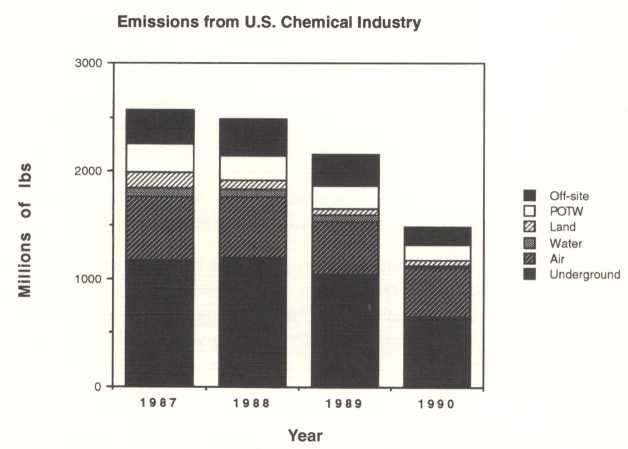
Emissions from the U.S. chemical industry to air, water, and soil have decreased by almost 50 percent since self-reporting began in 1987 (Figure 3), resulting in improved conditions in local areas. Hazardous wastes were indiscriminately disposed throughout the landscape until the Superfund Act of 1980. At a cost of billions, the problem is only now being remedied. We will spend billions more over the next 20 years cleaning up these groundwater and soil contamination problems that good “housekeeping” and modest foresight might have prevented. Evidence mounts that industry and government are being more responsible with waste treatment and disposal, and we should not have to deal with the same problems by the middle of the 21st century.
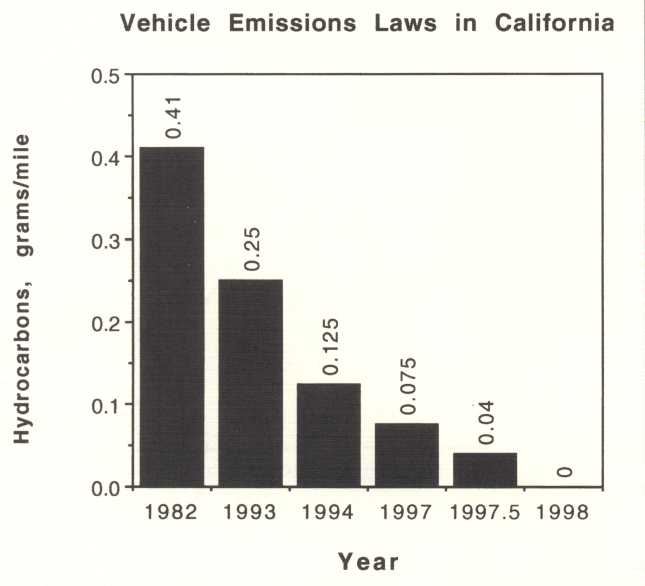
Air pollution in Los Angeles was notorious in 1960–1985, but there are signs now that the skies are beginning to clear. Again, improvements came at great cost. Remarkable reductions (10–40 fold) in vehicle emissions have been mandated since the early 1980s (Figure 4).[3] But they are necessary if we want clean air while population and the number of vehicle miles driven increase exponentially. Exponential increases in the driving forces of environmental change require exponentially increasing pollution control.
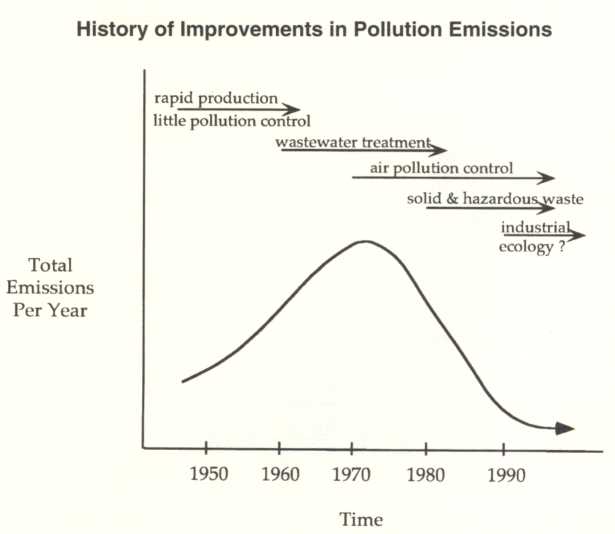
There has been a natural evolution of environmental laws in developed countries since World War II. During post-World War II expansion, industry grew with very little pollution control until about 1970. But gradually, emissions were mandated for water, air, and soil pollution as depicted in Figure 5. These improvements were generally “end of pipe” pollution controls which are no longer practical due to the marginal cost of further emissions controls and the ever-increasing removal efficiencies that are required.
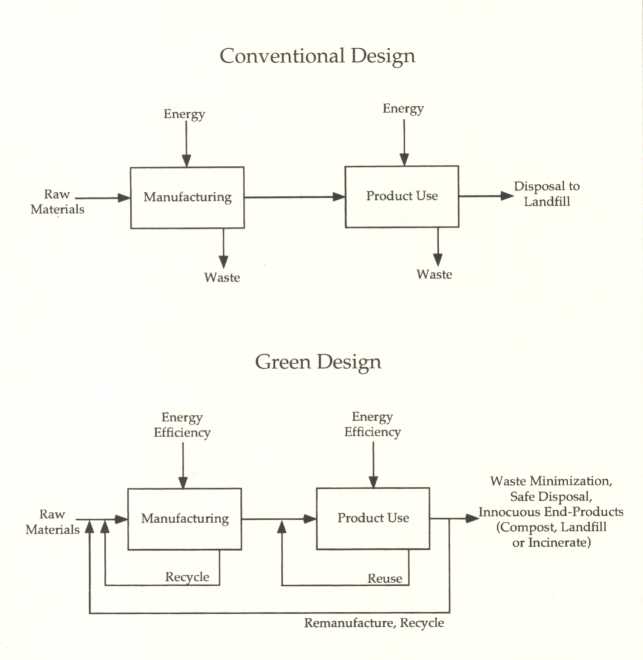
Industrial ecology is a new paradigm, where industry is the agent of change for environmental innovation and control. Many industries welcome the notion, believing that they know best how to design with the environment in mind. It may sound like putting the fox in charge of the chicken coop, but I believe we need to try innovative approaches. Government would set the goals and monitoring for environmental improvement, and industry would innovate using life cycle analysis of their products, pollution prevention programs, changes in operations, materials substitutions, and the three R’s (recycle, reuse, and remanufacturing) to achieve the goals. If this concept is to be effective, consumers must become involved also. No longer would it be acceptable to simply throw away our old Nike tennis shoes (regardless of how they smell)! We would take them back to the store where they would be shipped back to the manufacturer for incorporation into new tennis shoes (remanufacturing) or, less advantageously, asphalt roads (down-cycling). A simple rule would be: don’t sell it if you’re not willing to take it back—responsibility continues from the embryo of a product idea to its final disposition in the environment. A schematic of the change that is taking place in industry is shown in Figure 6 from “conventional design” (once through processing with large energy inputs and waste outputs) to “green design” (designing the product with the environment in mind).
In the College of Engineering, we are charged with teaching this new paradigm to our students if they are to be competitive in the world market. “Environmental” engineering is increasingly becoming synonymous with “superior” engineering. And the environment is big business. Two percent of our Gross National Product is spent on environmental controls, or approximately $157 billion per year.[4] Learning how to make products in a cost-effective, environmentally friendly manner will define successful companies in the world market place in the future.
Environmental Problems at the Regional Scale
In the U.S., industry dealt with increasingly stringent ambient air quality standards in the 1960s and 1970s, in part, by building tall stacks. Tall stacks carried the pollution away from the urban area so that people in cities like Gary, Indiana, could breathe again. The pollution was carried to remote locations where we did not fully understand its effects. Mesoscale (regional) pollution resulted in acidification of some lakes and a decline in rural air quality, especially acidic aerosols, fine particulate matter and ozone pollution. Our own mathematical models at the University of Iowa indicated that perhaps a total of 1000–2000 small lakes and streams in the Northeast, Upper Midwest, and southeastern United States became acidified by acid deposition (acid rain).[5] Studies culminated in the 1990 Clean Air Act Amendments which were the first to control sulfur oxides and nitrogen oxides due to acid deposition. Possible crop damages and human health effects of this regional pollution are still being assessed.
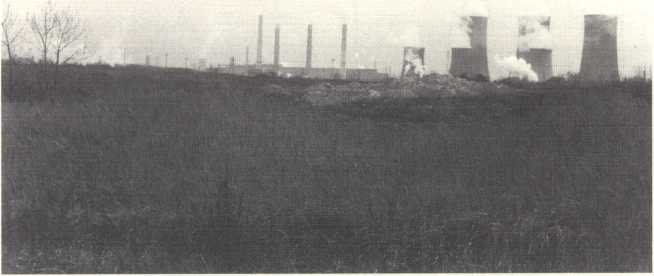
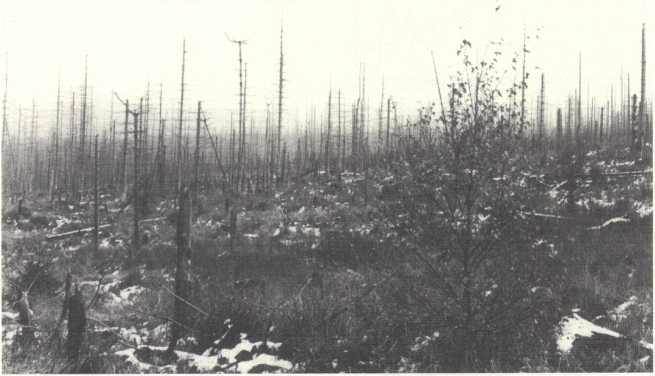
Local and regional air pollution in developing countries mostly was unabated through the 1980s. In former Czechoslovakia, the Communist government insisted on production without controls, and the environment suffered. (There is infinite demand for a free good.) The “polluter pays” principle was accepted theoretically, but not enforced, and the result was a devastated landscape as shown in Figure 7. Forest die-back has claimed about 200,000 acres in northwestern Bohemia and about half of the forests in the Czech Republic show symptoms of decline.[6] We are currently involved in a research project there to determine if agricultural soils and crops have become contaminated with excess toxic metals from regional atmospheric deposition.
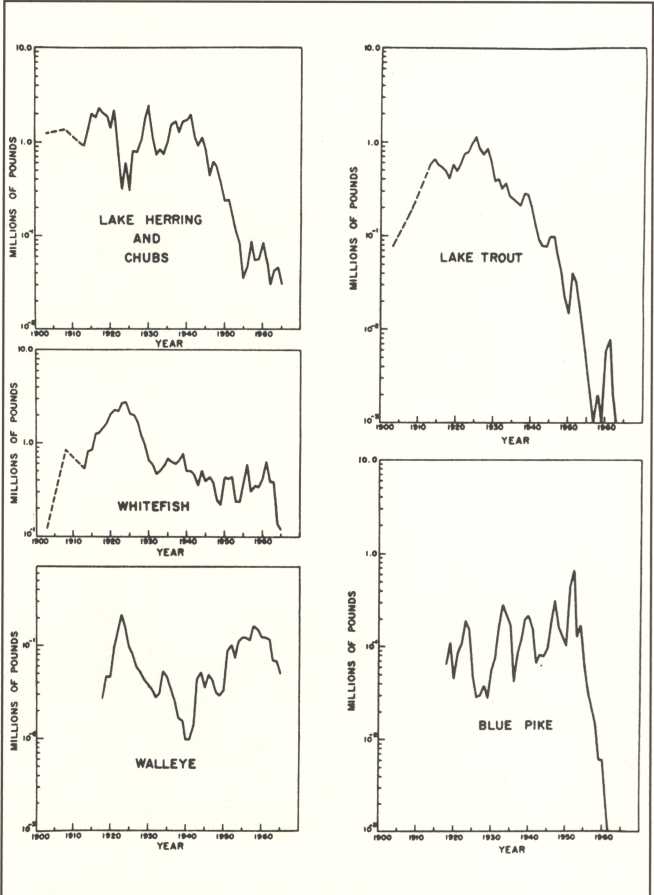
Another example of environmental problems at the regional scale is fisheries decline. Beeton[7], in a seminal paper in 1961, catalogued the history of decline of commercial fishing in the Great Lakes, almost one-quarter of the world’s fresh water (Figure 8). In the 1800s, changes were already occurring in commercial catch due to habitat alteration of streams and spawning grounds. By the mid–1900s, over-fishing, introduction of foreign species (such as the sea lamprey), and pollution all played important roles. In Lakes Erie, Ontario and parts of Huron, the bottom waters and sediments had become so eutrophic due to water pollution that they lost oxygen which, in turn, killed mayfly larvae and other species at the base of the food chain. Lake Erie was declared “dead” in 1965, about the same time that the Cuyahoga River caught fire in Cleveland. Today, the eutrophication problem has been greatly reduced by control of point source pollution, and sports fishing has recovered by restocking. Still, problems remain. There is a fishing ban on many species of salmon and lake trout due to biomagnification of toxic chlorinated hydrocarbons, principally polychlorinated biphenyls (PCBs), DDT, chlordane, and dieldrin pesticides, chemicals that were banned in the 1970s but are so persistent as to remain with us today.
As humans become more numerous, the threat of local pollution effects become regional. The recent crash of cod and flounder off the George’s Bank in New England is reminiscent of what happened 50 years earlier in the Great Lakes.[8] (If you are willing to eat dogfish instead of flounder, there is no problem.) The global fish catch is down since 1989, especially on a per capita basis, and there are reports of cod, flounder, and orange roughy (deepwater fish) populations crashing. These effects are primarily due to over-fishing, as humans try to harvest a treasure trove of marvelous protein that is in great demand, but they are failing once again to pay the true cost of replacing those fish once populations are decimated. We can only hope that most of these effects are reversible. Regional environmental problems can become global environmental problems in the absence of governmental sanctions and cooperation.
Global Environmental Problems
There is no upwind anymore. Everyone lives downwind from someone else. My students have analyzed sulfur pollution, lead, and soot at the peak of some of the highest mountains in the Swiss Alps and in the most remote regions of Norway. Polychlorinated biphenyls (PCBs) have entered the food chain of birds and mammals in the Arctic, Antarctica, and Midway Island in the middle of the ocean. Even though there are no pollution sources at those locations, and no human populations within 2000 miles, the chemicals are somewhat volatile and they travel long distances before being “cold-trapped” in these sensitive ecological areas.
The atmosphere is a relatively small compartment in the earth’s conveyor belt of environmental pollutants. It contains a mass of 5 x 10¹⁸ kg of air that is dwarfed by the ocean (1.4 x 10²¹ kg), but the ocean is an average of 3800 meters deep. Furthermore, residence times of pollutants in the atmosphere are short compared to those in the ocean. It is relatively easy to pollute the atmosphere. It responds quickly to global emissions, but it also cleanses itself more quickly when emissions are abated.
Greenhouse Gases
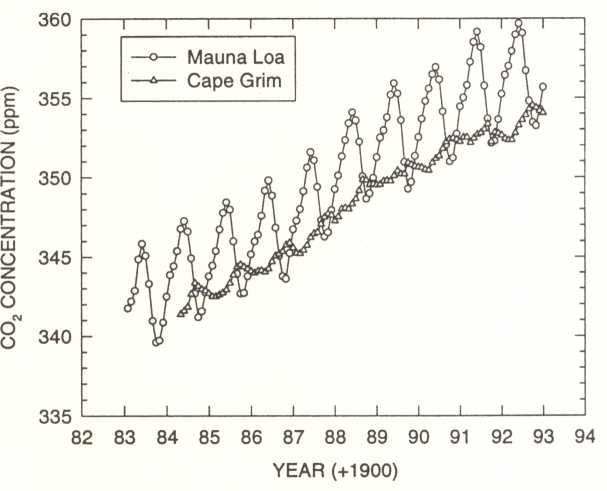
Table 1
Summary of Major Anthropogenic Greenhouse Gases (modified from Rodhe)[10]
| Gas | ppmv Concentration* | % Greenhouse Contribution | %/yr Rate of Increase | Half-life yrs | Relative Greenhouse Effect per kg | Relative Greenhouse Effect per mol |
|---|---|---|---|---|---|---|
| CO2 | 355 | 55–60 | 0.4–0.5 | 150 | 1 | 1 |
| CH4 | 1.7 | 15–20 | 0.7–0.9 | 7–10 | 70 | 25 |
| N2O | 0.31 | 5 | 0.2 | 150 | 200 | 200 |
| O3 | 0.01–0.05 | 8 | 0.5 | 0.01 | 1800 | 2000 |
| CFCl3 | 0.28 ppbv | 4 | 4 | 65 | 4000 | 12,000 |
| CF2Cl2 | 0.48 ppbv | 8 | 4 | 120 | 6000 | 15,000 |
*concentrations are on a volumetric basis (mixing ratios)
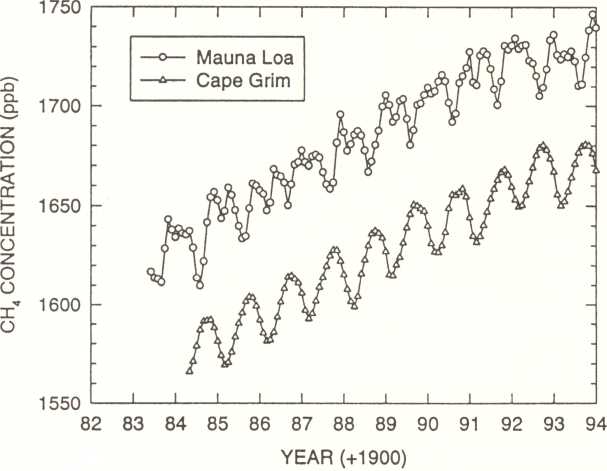
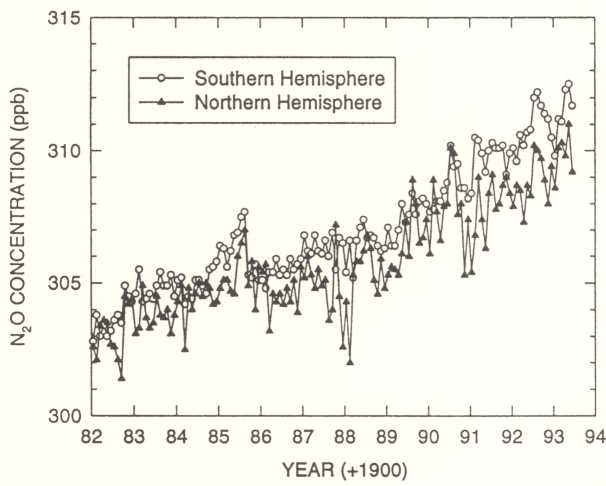
Greenhouse gases are increasing in the atmosphere. Carbon dioxide (CO2) from fossil fuel emissions is increasing at 0.4–0.5% per year (Figure 9).[9] A little more than half of the anthropogenic greenhouse gas effect is due to carbon dioxide (Table 1).[3] Methane (CH4) concentrations in the atmosphere, another potent greenhouse gas, are increasing at ~0.7% per year, mainly due to flooded agriculture (rice production) and animal husbandry required to feed an expanding population (Figure 10).[9] But there is some good news: the rate of increase in methane concentrations is beginning to decline, perhaps because leaks at natural gas pipelines have been controlled. Nitrous oxide (N2O) is the result of increasing fossil fuel emissions, slash burning of forests, and nitrogen fertilizer applications worldwide. As ammonia-nitrogen is oxidized in the soil and nitrate fertilizer is denitrified, nitrous oxide represents a chemical of intermediate oxidation state, which is volatilized to the atmosphere. Figure 11 shows that N2O is increasing rapidly in the atmosphere and, even though it is only ~5% of the anthropogenic greenhouse gas effect, it will be a difficult gas to control.[9] Fertilizer applications of ammonia, ammonium nitrate, and ammonium sulfate are likely to increase worldwide.
Climate Change
The increase in greenhouse gases in the atmosphere has led to concern regarding the potential for global warming and climate change. The effect is analogous to rolling up the windows of your car on a bright summer day. Short wave solar energy can pass the windows striking the interior surfaces of the car. But long-wave radiation cannot escape back through the windows, and the temperature rises. Greenhouse gases also absorb long-wave radiation, and they are increasing in the atmosphere (Table 1), but it is not certain whether climate has been affected.
The vast majority (~98%) of earth’s greenhouse effect is natural, caused by water vapor and carbon dioxide. Without these gases, earth would be so cold as to be uninhabitable, 33°C (59°F) cooler than it is presently. The annual global mean surface temperature of earth is 15°C (59°F), and the global temperature in the absence of natural greenhouse gases would be a frigid -18°C (0°F). The “greenhouse effect” is natural and it is beneficial to life on Earth.[11]
Concern arises because anthropogenic greenhouse gases are increasing including carbon dioxide, methane, chlorofluorocarbons, nitrous oxide, and ozone (CO2, CH4, CFCs, N2O, and O3, and; Table 1). Ozone in the lower atmosphere, troposphere, is increasing despite the loss of the ozone layer in the upper atmosphere or stratosphere. These greenhouse gases have the potential to change climate if left unabated. Molecules with more than two atoms (like the windows of the car) absorb long-wave radiation, and when they do, the earth’s surface warms. The relative effectiveness of each of the gases is not equal. Table 1 shows that CFCl3 (CFC-11) and CF2Cl2 (CFC-12) are 12,000 and 15,000 times more effective, respectively, at absorbing long-wave radiation compared to carbon dioxide on a molar basis.[10]
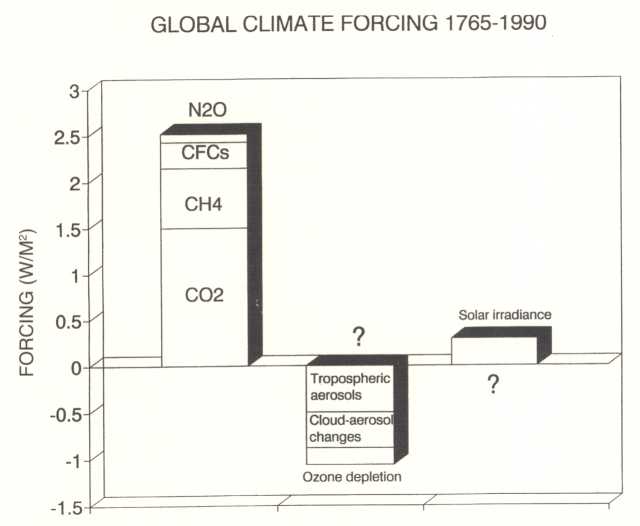
Calculated changes in the Earth’s radiation budget as a result of increasing greenhouse gases are shown in Figure 12. Carbon dioxide has increased 27% from 280 ppm in 1765 to 355 ppm in 1990. A total change of 2.5 watts/m2 is attributed to anthropogenic greenhouse gases to date. To put the number into perspective, a standard Christmas tree light bulb puts out ~4 watts of energy, so if there were one additional light bulb of this kind shining continually on every square meter of the earth’s surface, it would result in a climate forcing of 4 watts/m2 This climate forcing is small relative to the total input of energy from the sun (the solar irradiance or solar constant) of 1372 watts/m2.[11] The solar constant is not constant—it varies with sunspot activities and other factors (± 0.1 %), and it may have increased a little in recent times (Figure 12).[12] Also, humans have put more sulfur dioxide into the atmosphere (from coal combustion) which results in the formation of sulfate aerosols and brighter clouds (albedo increases) that cause “global cooling” (Figure 12).[12] This cooling effect is somewhat less than the calculated warming effect due to greenhouse gases. However, there is considerable uncertainty in all of these effects, and they are estimated by use of global dynamic models, General Circulation Models or GCMs.
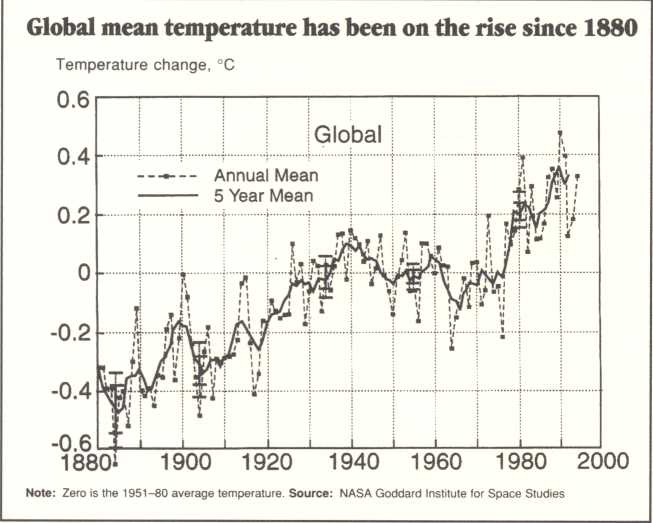
We are currently in a relatively warm climate pattern (Figure 13).[13] The global average surface temperature of the earth is ~0.5°C warmer than the earliest period of record, 1860. But this temperature change is still within the inter-annual variability of temperature (±0.7°C) due to large-scale circulation patterns (e.g., El Niño Southern Oscillation events) that we do not fully understand. Eight out of nine of the warmest years on record have occurred since 1980 (1980–1995) in a 135-year period. Last year, 1995, was the warmest year on record and 1990 and 1991 were close seconds. 1992 and 1993 were relatively cool because sulfur dioxide and ash particles were blown high into the atmosphere (>35,000 ft) by the eruption of Mt. Pinatubo volcano. All of these observations have been modeled with some success using General Circulation Models (GCMs).
Last December, representatives from 120 nations and the Intergovernmental Panel on Climate Change met to discuss the issues of global change. For the first time, they agreed that while many uncertainties remain, “the balance of evidence … suggests a discernible human influence in global climate.”
The best estimate of warming is 1.0-3.5 °C (1.8-6.3 °F) with a most probable estimate of 2.0 °C (3.6 °F) by the middle of the 21st century (Intergovernmental Panel on Climate Change, IPCC, Second Assessment Report, 1996). If carbon dioxide and other greenhouse gases continue to increase, all models predict a warming trend in the 21st century. Precipitation would increase globally, but mid-continental areas, like Iowa, would probably become warmer and drier. Sea level has been rising already, about 3.9 ± 0.8 mm/year in 1993 and 1994.[14] It would continue to rise by 15-95 cm by the year 2100, enough to cause salinity intrusion into the drinking water supply of coastal cities and inundation of coastal properties on barrier islands. One of the greatest economic costs of global warming is expected to be health related, including an increase in malaria and schistosomiasis and problems of extreme heat affecting the elderly. Although an average temperature increase of 3.6 °F may not seem like much warming, it could affect the extremes of weather considerably, resulting in greater hurricanes, droughts, floods, and costs to society. The biggest proponent of further controls on carbon dioxide emissions is the insurance industry, which has been monitoring the Climate Convention and the Commission on Sustainable Development closely. Insurers are worried that the escalating claims in recent years due to storms will leave them bankrupt.
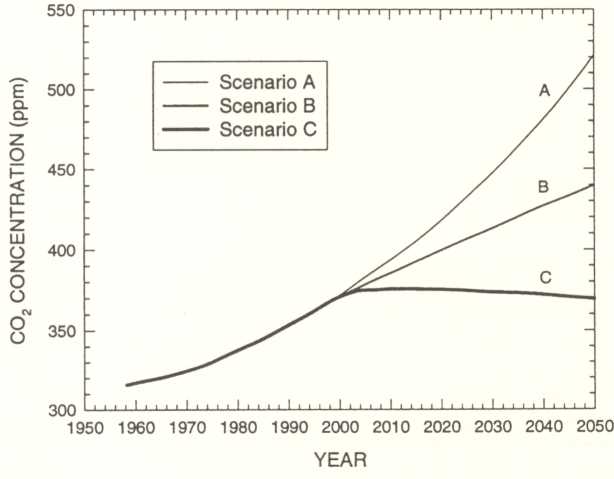
We have developed a model to predict atmospheric concentrations of carbon dioxide.[15] Our global budget for anthropogenic carbon sources and sinks to the atmosphere in Table II shows that most of the carbon dioxide is transferred to the biosphere (uptake by terrestrial vegetation) and absorbed by the oceans, but the remainder accumulates in the atmosphere with a lifetime on the order of 125 years. If emissions continue as projected in the mid-case scenario by the Intergovernmental Panel on Climate Change at approximately 1.5% per year, carbon dioxide will increase to 550 parts per million by volume (ppmv) by the middle of the 21st century, and global warming will certainly occur (Figure 14). Assuming that we are able to control emissions at 1990 levels, as recommended by the Climate Convention that was signed at the Rio Earth Summit in 1992, COª concentrations will begin to level off at ~450 ppmv, and a more modest increase in global warming would be expected. The grim news is that it would take a substantial reduction in carbon dioxide emissions to limit concentrations to their present levels. A cutback of ~70%, a rollback of emissions to levels similar to 1950, would be required to maintain emissions at the current 360 ppmv.
TABLE II
Global Carbon Anthropogenic Sources and Sinks Based on SGCM Box Model in the Year 1989[15]
Carbon Sources Gt-C/yr |
Carbon Sinks Gt-C/yr |
||
|---|---|---|---|
Fossil Fuel Emissions |
6.0 |
1.2 |
Biosphere Uptake |
Deforestation |
1.2 |
2.5 |
Oceanic Uptake |
3.5 |
Atmosphere Accum. |
||
TOTAL |
7.2 |
7.2 |
As humans become ever more numerous and consumptive, our emissions and pollution begin to rival natural processes of nature’s cycles. At first this occurs locally, then at regional scales, and finally globally. Global atmospheric pollution is the first of earth’s reservoirs to be affected because it is the smallest. Table III shows that for methane releases and carbon monoxide (CO), anthropogenic emissions already surpass those of nature.[16] It is also true for sulfur dioxide and nitrogen oxides. Human effects are pervasive. In 1750, when the global population was one billion, people had an average of 29 acres of habitable land per person, but today the number is about five acres. And in these five acres per person, we must feed ourselves, supply shelter and energy, and allow for the cohabitation of four million or more species of plants and animals. The world is still a big place and much accommodation is possible, but only with education and good government can we make progress towards providing for humans while not despoiling the environment.
TABLE III
Trace Gas Emissions* from Anthropogenic and Natural Sources[16]
Natural Sources |
||||
Anthropogenic Sources |
Ocean |
Continents |
TOTAL |
|
|
N2O |
6.5 |
2.0 |
11.5 |
20 |
|
CH4 |
274 |
11 |
109 |
394 |
CO |
500 |
71 |
29 |
600 |
NMHC |
125 |
90 |
920 |
1135 |
* Units: Tg-C/yr for carbon species; Tg-N/yr for N2O
CFC and Stratospheric Ozone Depletion
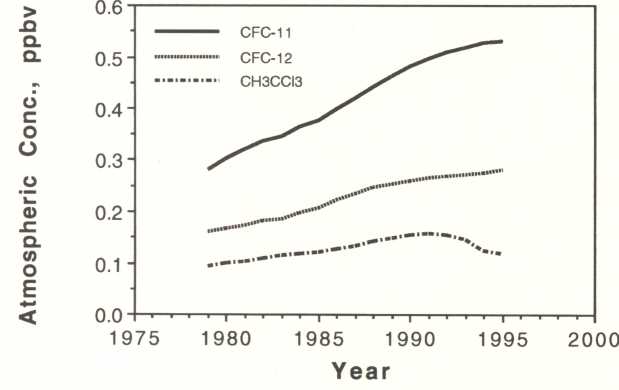
Chlorofluorocarbon (CFC) concentrations are also increasing, and they have a long half-life in the atmosphere (Table I). They are used as refrigerants, blowing agents, and cleaning chemicals in the microelectronics industry. Two of the most widely used are CFC-11 (CFCl3, trichlorofluoromethane) and CFC-12 (CF2Cl2, dichlorodifluoromethane). Due to their persistence in the lower atmosphere, they are transported into the stratosphere where they deplete the ozone layer that shields us from harmful ultraviolet radiation. The Montreal Protocol of 1987 and subsequent amendments (London, 1990; Copenhagen, 1992) have banned the production of CFCs by the year 2000. From conception of the problem by Mario Molina and Sherwood Rowland[17] in 1974, to measurement of the Antarctic ozone hole in 1985, and acceptance of the problem by industry and the scientific community in 1987, the control of CFC chemicals is one of the major success stories of international environmental cooperation.[18], [19] Methyl chloroform, a potent ozone-destroying chemical, is now decreasing in the atmosphere[19] as a result of the Montreal Protocol (Figure 15). Fortunately, the problem is not irreversible, and the stratosphere is responding to decreased loadings of methyl chloroform. Other CFC chemicals will do likewise within the next couple of decades. For their analysis of the problem, Molina, Rowland, and Paul Crutzen were awarded the Nobel Prize in Chemistry, and environmental science came of age in 1995! Still, due to long half-lives of the chemicals in the stratosphere, ozone depletion will continue for some years. CFC chemicals also account for a significant fraction of the anthropogenic greenhouse gas effect.
Biodiversity, Habitat Alteration, and Species Extinctions
Globally, the clearing of land for agriculture and commerce amounts to ~50,000 mi2 per year or roughly the area of the State of Iowa.[20] It results in destruction of habitats for plant, animal, and microbial species. Approximately 100,000 species per year are thought to become extinct, from a total of perhaps 4–40 million species.[20] Half of that biodiversity is in the tropics and developing countries, so the clearing of tropical rain forests is of particular concern. Nations are clearing roughly 0.5% of the forests each year. If this causes a loss of half of all natural species present, the rate of extinction would be ~0.25% per year, a very grave long-term problem.
The calamity of species extinctions is that it is truly irreversible. Once we have lost the species, we cannot bring it back (Jurassic Park notwithstanding). In 1961, President John F. Kennedy designated Cape Canaveral on Merritt Island, Florida, as the permanent site of our new space program. He could not have known that near the path of the Mercury, Gemini, and Apollo rockets lay a tiny sparrow with one of the smallest ranges of any known animal, the Dusky Seaside Sparrow. At that time, there were approximately 6000 sparrows in the nearby marsh along the Banana River, according to an account by Jonathan Wiener in The Next One Hundred Years,[21] but each expansion at Cape Canaveral required more highways, development, and marshes to be drained. By 1968 a census counted 2000 Duskies. However, in 1986, despite a reserve program by the U.S. Fish and Wildlife Service, zoologists scoured the mile-and-a-half range to find only six individuals remaining, all males. Their fate was sealed. The last individual was named Orange Band, and he was still living in a cage on Paradise Island at Walt Disney World in 1986. He was a little overweight, with the gout, and partially blind, and he didn’t fare too well on take-offs and landings, but he was truly one of a kind. Orange Band died in June of 1987. Who cries for a sparrow? This is not to suggest that President Kennedy should have done anything differently even if he had known about Orange Band. Rather it is the story of inevitable conflict between human development and habitat fragmentation.
The story is not meant to be a metaphor for our own fate. Quite to the contrary, we are a tremendously successful species, and I fear more for our own success and the slow, almost imperceptible, decline in the quality of life as we lose other creatures. A colleague of mine at the University of Wisconsin, John Magnuson, calls it the “invisible present,” when events move too slowly to be appreciated in real time, yet their accumulation results in real change over decades. Special precaution must be taken to avoid irreversible environmental changes such as the extinction of species because there is nothing that we can do to make amends. We grow slowly poorer.
Environment and Development
Global poverty is perhaps the greatest environmental problem of them all. 1.3 billion people lack safe drinking water; 2.3 billion lack access to sanitation facilities; 1.5 billion do not have enough firewood or fuel for cooking and heating; and 13 million children die each year from diarrhea, dysentery, and hunger.[22] I was fortunate to go to the Rio Earth Summit in 1992 with Burns Weston and Geoffrey Palmer from our College of Law and Dorothy Paul, Director of the United Nations Association-Iowa Division. Naive though I was, I thought that maybe I could contribute to the discussions of how best to limit our carbon dioxide emissions. I learned quickly that the meeting was not just about the environment; it was really about power, politics, and social justice. At the Earth Summit, I first understood what the developed countries were asking of the developing world. The developed world has put all of the CFCs into the atmosphere (at great profit) and 75% of the excess carbon dioxide. We have cleared most of our native forests and emitted most of the pollution. Now we bring to the table, to poor developing countries, treaties that specify that everyone must change their ways because we are harming the atmosphere and biodiversity. But their children are dying! They call our problems the “loud problems” because of all the noise that we make about them. Their problems have to do with basic sanitation, education, and health. Thus, we have no credibility.
The United States releases about 30 times as much carbon dioxide per person as India. Because our population is approximately 250 million, and theirs is almost one billion, we emit roughly seven times more CO2 than they do. Their population is growing much faster than ours. But even though our population grew by 1.3 million last year compared to India’s 18 million growth, we still added about twice as much carbon dioxide to the atmosphere as they did from intrinsic population increases. It really hit home for me when one gentleman from a developing country asked me, “Professor Schnoor, how many children do you have?” And I said quite proudly that I had only two. “Well, that would be equivalent to 18 children in resource equivalents for my country,” he replied good-naturedly.
There is plenty of blame to go around, but this much is clear: 1) Western countries must decrease their consumption patterns, and 2) developing countries must limit their population growth if we are to limit pollution and enhance the quality of life. Developing countries need investment in their infrastructure, schools, hospitals, water supply and sewage treatment. Education, particularly education of women, will accomplish the decrease in birth rates that is desired, and there has been progress. At the recent Beijing World Conference on Women, it was pointed out that females have advanced twice as fast as males in literacy and school enrollment in developing countries. This is, in part, because they were so far behind their male counterparts, but there are some encouraging signs. China has raised women’s literacy rates from essentially zero percent to 82% literacy in the past 50 years. Many of the world’s poorest countries have raised female literacy by as much as 30 percent since 1970.
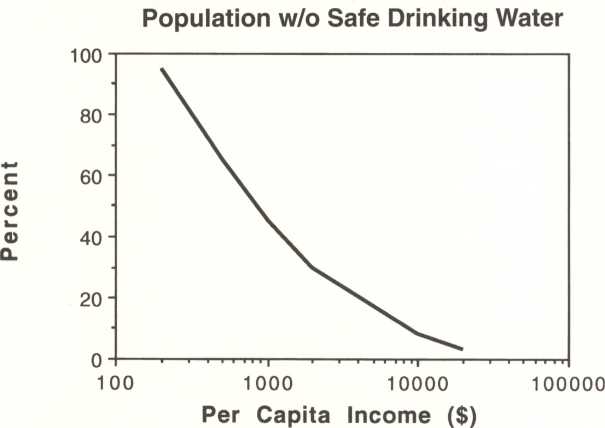
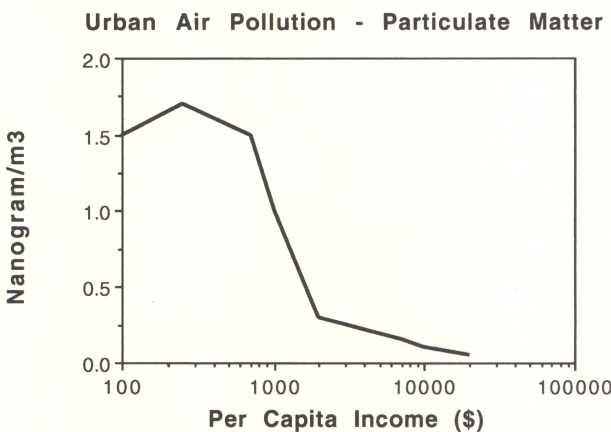
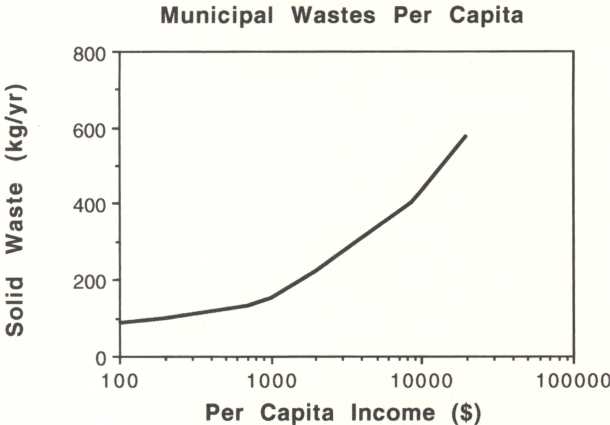
There is a natural succession that takes place as countries develop (Figure 16). First, some improvement in basic sanitation and drinking water occurs with initial development and increases in the GNP per capita. Meanwhile, urban pollution becomes more acute with dirty, extractive industries often characterizing early development. Finally, as per capita income reaches a threshold level, urban air and water pollution begin to improve as the country has more capital to invest in pollution control and infrastructure improvements. Unfortunately, consumption per capita continues to increase with continued development, much as it has in the United States. And why not? We have never developed the culture necessary to change consumption patterns. In the future, progress for a developed nation should mean limiting waste products and making optimum use of natural resources for future generations.
We must decouple consumption from GNP and quality of life, and it is possible to do so.
Earlier, I mentioned that control of carbon dioxide concentrations in the environment would require a 70% decline in fossil fuel emissions. This is not likely, considering the need for South Asia, Africa, and Latin America to develop. By the year 2020, Asia’s emissions of sulfur oxides and nitrogen oxides will be greater than those of North America and Europe combined![26] They are the elephant in the bathtub. They are at the second stage of development, where basic sanitation has been achieved but emissions are only just beginning to be controlled. The best scenario involves developing countries helping them with technology transfers at little or no charge. In this manner, Asian countries become good trading partners, and the environment is protected in the best way possible. Developing countries should be able to “leap-frog” many of the environmental mistakes that we made in the past.
Energy intensity (energy consumed per $ GDP) has declined among Western countries about 25% during the period 1970-1988, while quality of life indices have improved.[22] For the first time, nations have been able to decouple productivity from energy consumption. This means that the conventional wisdom that you must expend a lot of energy to live better is no longer true. A key question is whether and how quickly developing nations like India and China can do the same. Think globally, act locally. One of our students, Richard Ney, and I recently completed a report on emission of greenhouse gases in Iowa.[23] Because of Iowa’s sparse population density (meaning long travel distances), continental climate, and high-input agriculture, we are 15th worst among the 50 states in greenhouse gas emissions per capita. Each Iowan emits, on the average, 29 tons of carbon dioxide per year to the atmosphere. Every time we fill up our car with gas (10 gallons), 190 pounds of C02 is released upon combustion! On a per capita daily average, we generate 5 lbs of garbage, 5–10 lbs of hazardous waste, 160 lbs of carbon dioxide; and dispose to the sewer 150 gallons of water (more if you have teenagers). Each person in Iowa generates more than their weight in waste each day! There is plenty of room for improvement.
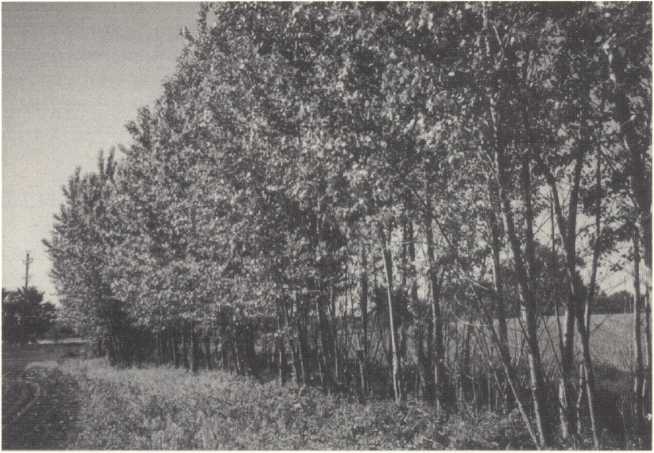
Louis Licht, a student of mine in the mid–1980s, had a simple idea. He wanted to plant trees. I tried to dissuade him—it wasn’t “academic” enough—but he was persuasive, and I acquiesced. At first, we planted trees for agricultural runoff control at Amana, Iowa. Then, we estimated the huge amount of carbon dioxide that fast-growing hybrid poplar trees could sequester out of the atmosphere and into woody tissue, and we planted more trees for carbon dioxide sequestration. And, most recently, we have been planting trees at hazardous waste sites because, it turns out, they are capable of metabolizing a wide variety of toxic organic pollutants. In total, we have planted more than 200,000 trees in six states and three countries.
Sometimes it helps to list hopeful prospects now that we have de lineated our environmental nightmares. Table IV is such a list of hopeful signs in the world of global change. Some have said that environmental science has displaced economics as the dismal science. (Not at all: we can merge the two into environmental economics and really get depressed!) Whether deep ecologists will admit it or not, civilization is making some progress, at least in the areas of pollution control, human health, life expectancy, infant mortality, democratization, and education. Whether conservative fundamentalists will admit it or not, environmental controls have been quite successful at a cost of only 2% of GNP; environmental technology represents a new area of business expansion in the 21st century; and preservation of species has been relatively inexpensive, unobtrusive, and successful.
Table IV
Success Stories in Environment and Development
Progress in human health (life expectancy and infant mortality)
Decreases in energy intensity among developed countries
Rising global per capita income
Global democratization
Women’s literacy rates
The Montreal Protocol and control of CFCs
Industrial Ecology and the multinational role of industry
The use of market forces in pollution abatement (tradeable permits, phaseout of subsidies)
International Cooperation at the Rio Earth Summit and agreements on: Climate Convention
Biodiversity
For example, the U.S. Endangered Species Act (ESA), contrary to much of its recent publicity, has been quite successful and cost-effective. It was signed in 1973 by President Richard Nixon, who said, “Nothing is more priceless than the rich array of animal life with which our country has been blessed. It is a many faceted treasure.” Of the 909 species listed as endangered, more than 99% continue to exist and 41% of the plants and animals are stable or improving.[27] Eight species, including the brown pelican, Arctic peregrine falcon, and the Palau dove, have completely recovered and been removed from the endangered list. The American alligator, bald eagle, black-footed ferret, gray and red wolves, whooping crane, and southern sea otter have all improved markedly. All of this protection came at a federal cost of $57 million dollars in FY 1996. (One C-17 transport plane costs $300 million.) The Endangered Species Act has had very little impact on economic development. It only affects about one percent of all projects and most of those continue with modifications. It has claimed about 9000 jobs, and those were all connected with the Northern Spotted Owl and small sawmills that were already in decline, unfortunately.[27] There will be conflicts in the future because the opportunity for tension between human development and animal habitat becomes greater as we develop more land. The environment and the Endangered Species Act enjoy enormous public support for reasons that defy political strategists—people are quite intelligent and they have a real sense of the sacred. There are some aspects of the human experience that are just too precious to toss away.
Prospects for the Future
Untold future generations have the right to enjoy a high quality of life, as we in the developed world have. This concept embodies the “Sustainable Development” movement, which dominates environmental political discussions today. It was first stated in 1987 in a seminal document, Our Common Future by Gro Brundtland, Prime Minister of Norway, as “Meeting the needs of the present without compromising the ability of future generations to meet their own needs.”[28] We should not foreclose on our children’s future by preemptive utilization of resources that they will need. While conceptually powerful, it is a difficult paradigm to implement because we do not know exactly how our actions today will affect future generations nor what resources they will need. Quite anthropocentric, it encompasses the desire for ecological preservation only through the needs of future generations. Abraham Maslow, the father of humanistic psychology, thought that there are four basic human needs in successive order: 1) food and water, 2) safety and shelter, 3) love and family, and 4) self-actualization or fulfillment. It is only the final human need that may touch on sociological goals of harmony in our society and ecological harmony (?) between humans and our environment.
I might go further in defining the needs of future generations. In this kind of “Eco-logic,” the following questions would be relevant to any action taken by individuals, government or industry:
- Is it irreversible?
- Is it persistent? Over what time scale?
- How uncertain are the consequences?
- Is it socially just?
If the action is irreversible, we simply should not do it. Examples include species extinctions, soil erosion, and the clear-cutting of tropical forests (where soil runs off after trees have been cleared). We must make it our highest priority to avoid short-term gains of this nature, which preclude future generations from having access.
Is it persistent and over what time scale? How many generations will be affected and at what cost? Adam Smith’s invisible hand is not so good at incorporating externalities into the cost of goods that pollute the air, water and soil over long time horizons. Examples of persistent chemicals that probably should not have been used include pesticides like DDT, dieldrin, and chlordane, and industrial chemicals such as polychlorinated biphenyls (PCBs). In retrospect, we did not know that these chemicals would be responsible for extinction of species and eggshell thinning over 50 years, but that does not explain why we continue to manufacture them and, in some cases, sell them overseas to the developing world.
How uncertain are we about the consequences of a particular action? You see, the problem is that our decisions today impact the next 20 generations, 200 billion unborn people, who are not seated at the table. They have no vote on our referendums and no voice in our deliberations. It is a concern of generational equity. Because of that, we must act with the utmost caution in cases where scientific uncertainty is great and the consequences of the action are large. Some have called this the Precautionary Principle and stated it as, “Where there are threats of serious or irreversible damage, lack of full scientific certainty should not be used as a reason for postponing cost-effective measures to prevent such environmental degradation.” But a more populist version says, “If we live as if it matters and it doesn’t matter, it doesn’t matter. If we live as if it doesn’t matter, and it matters, then it matters.”
Is it socially just? As the bumper sticker says, If you want peace, work for justice. In the final analysis, whatever we do as a nation affects future generations by the legacy that it leaves behind. In the United States, we emit 20–25% of the world’s pollution for 5% of its people. Among Western countries, it is neither socially just nor politically stable for 20% of the world’s population to use 80% of its resources. It is in our own best interests to help developing nations. In addition, they are the market for our products in the future, and they will provide us with much-needed nonrenewable resources through trade. We must strengthen the United Nations and move towards a global identity in the 21st century. Current trends against multilateralism and foreign aid have no place in the global village that emerges. I still meet many elderly Germans who feel kindly towards the United States because of the Marshall Plan after World War II. Good will lasts for a generation, but hatred lasts for centuries.
We are in a global race, a race to educate faster than eradicate, a race to improve institutions and the human condition faster than population growth and consumption. We should view our environmental predicament in its historical context, we should seek solutions rather than blame, and we should seek to understand before expecting to be understood.
Pressure on the planet will increase. We can expect that we will lose more land and more species, but I think that we can and must slow the process. If we want developing countries to limit their emissions, to preserve their biodiversity, and to protect their tropical forests, so that we (the developed world) may continue to enjoy a high standard of living, then we will have to pay for it in some way. We can gain credibility by helping other countries with technology transfer, development, and by controlling our own consumption patterns. For their part in this Social Contract, they must use the transfer payments for the betterment of their people and to protect their environment. We have learned from the past that nations cannot have successful economic development if they destroy their environment and resource base. Likewise, nations cannot protect their environment without a healthy economy and eradication of poverty. Environment and development go hand in hand, but we must do it smarter.
I have the best job in the world. I am most grateful to this great institution, The University of Iowa, for all its support during the past 20 years. I have been blessed with creative, hard-working students and a wonderful faculty of colleagues to pursue these ideas. What can we do to assure a successful 21st century? Most of all we can educate. Teaching is a noble profession and, after all, it is teachers who will play a very large role in developing a society with wisdom and opportunity. In the words of Baba Dioum, a noted Central-African conservationist, “For in the end we will conserve only what we love. We will love only what we understand. And we will understand only what we are taught.”
Acknowledgments
I am indebted to many students and colleagues for the research effort described here. Among the students who have contributed most directly to this work, I am grateful to O-Yul Kwon, Kurtis Paterson, Richard Ney, Disa Wahlstrand, Astrid Rautengarten, Randy Krutzfield, Levi Brekke, Y.L. Yan, James Jordahl, and James Szydlik. Burns Weston, Geoffrey Palmer, and Dorothy Paul introduced me to the world of ideas surrounding the United Nations Conference on Environment and Development which so influenced this talk. Colleagues at the University of Iowa have been an inexhaustible source of encouragement including Greg Carmichael, Burton Kross, James Merchant, Wayne Paulson, Gene Parkin, Richard Valentine, Pedro Alvarez, and Annmarie Eldering. Collaborators at other institutions include Peter Jaffe, Chip Levy, and Robert Socolow, Princeton University; James Galloway, University of Virginia; Bedrich Moldan, Tomas Paces, and Jiri Cerny, the Czech Geological Survey; Eugene Tackle and Mike Chen, Iowa State University; and William Stigliani, University of Northern Iowa. Our greenhouse gas action plan for Iowa has been developed with the help of Larry Bean and Roya Stanley of the Iowa Department of Natural Resources. A special thanks goes to Louis Licht, who initiated the idea of reforestation using hybrid poplar trees for nonpoint source runoff control at Amana, Iowa, an idea, which has grown into many field applications across the U.S. and abroad. I thank Jane Frank and Connie Mutel of the Center for Global and Regional Environmental Research (CGRER)—most of these activities would not have been possible without CGRER and the support of the College of Engineering at the University of Iowa.
References
[1] World Bank, World Development Report 1991, Oxford University Press, New York (1991).
[2] Thayer, A.M., Chemical & Engineering News, 22–52, November 16 (1992).
[3] American Institute of Physics, The Inclustrial Physicist, 20, November (1995).
[4] Silverstein, M., The Environmental Economic Revolution, St. Martin’s Press, New York (1993).
[5] Schnoor, J.L., et al., Journal of Water Pollution Control Fecleration 58(11), 1030–1033 (1986).
[6] Moldan, B. and Schnoor, J.L., Environmental Science & Technology 26(1), 1421 (1992).
[7] Beeton, A.M., In Eutrophication: Causes, Consequences, Correctives, National Academy of Sciences, Washington, D.C., 24–149 (1969).
[8] World Resources Institute, Science 264, 1 April (1994).
[9] Boden T.A., Kanciruk, P., Farrel, M.P., Trends ’93 A Compendium of Data on Global Change, Oak Ridge National Laboratory, U.S. Department of Energy, Oak Ridge, TN, (1993).
[10] Rodhe, H., Science 248, 1217 (1990).
[11] Graedel, T.E. and Crutzen, P.J., Atmospheric Change—An Earth System Perspective, W.H. Freeman and Company, New York (1993).
[12] Intergovernmental Panel on Climate Change, Climate Change 1994-Racliative Forcing of Climate Change and An Evaluation of the IPCC IS92 Emission Scenarios, Cambridge University Press (1995).
[13] Intergovernmental Panel on Climate Change (IPCC). Climate Change, The IPCC Scientific Assessment, Cambridge University Press, Cambridge, U.K. (1990).
[14] Nerem, R.S., Science 268, 5 May (1995).
[15] Kwon, O.Y. and Schnoor, J.L., Global Biogeochemical Cycles, 8, 295–305 (1994).
[16] Yan, Y.L., Ph.D. Dissertation, The University of Iowa, Iowa City (1993).
[17] Molina, M.J. and Rowland, F.S., Nature, 249, 810 (1974).
[18] World Meteorological Organization (WMO). Scientific Assessment of Ozone Depletion: 1991, Report No. 25, Geneva, Switzerland (1992).
[19] Ravishankara, A.R. and Albritton, D.L., Science, 269, 183 (1995).
[20] Mann, C.C., Science, 253, 736 (1991).
[21] Weiner, J., The Next One Hunclrecl Years, Bantam Books, New York (1990).
[22] United Nations Development Report, United Nations, New York (1992).
[23] Ney, R.A. and Schnoor, J.L., Iowa Greenhouse Gas Emissions Inventory 1992, Center for Global and Regional Environmental Research, 95–01 (1995).
[24] Licht, L.A., Ph.D. Dissertation, The University of Iowa, Iowa City (1990).
[25] Schnoor, J.L., Licht, L.A., McCutcheon, S.C., Wolfe, N.L., Carreira, L.H., Environmental Science & Technology 29(7), 318A–323A (1995).
[26] Galloway, J., Journal of Water, Air, and Soil Pollution 85(1), (1995).
[27] Watkins, T.H., Audubon 98(1), 37–58 (1996).
[28] Brundtland, G., Our Common Future, United Nations Publications, New York (1987).
[29] Myers, N., Ambio 22(2–3), 74–79 (1993).
[30] Schnoor, J.L., Environmental Science & Technology 27(1), 18–22 (1993).